
Recovery Scores Explained: What Readiness Numbers Can and Can't Tell You
Recovery and readiness scores blend real physiology — overnight HRV, resting heart rate, sleep — into a proprietary number that can't see your context. Here is what the research says these scores can genuinely tell you, where they mislead, and why how you feel is data too.
You wake up, glance at your wrist or your phone, and a number tells you how recovered you are. Sixty-eight. Amber. Take it easy today. Recovery scores, readiness scores, body-battery-style metrics — nearly every tracking platform now serves a morning verdict, and millions of people let that verdict set the tone for the day before their feet have touched the floor.
The physiology underneath these scores is real and worth understanding. But the score itself is a proprietary recipe, not a measurement — and the research on monitoring training stress holds a finding the marketing rarely mentions: how you feel, honestly recorded, tracks your recovery about as well as the sensors do, and sometimes better. This article unpacks what readiness numbers actually blend together, what they can genuinely tell you, where they mislead, and how to use them without outsourcing your own judgment.

What Actually Goes Into a Recovery Score
Strip away the branding and most recovery platforms blend the same handful of overnight inputs. The core is heart rate variability (HRV) — the small variations in timing between one heartbeat and the next. Those variations are steered by the autonomic nervous system: when the parasympathetic “rest and digest” branch dominates, the gaps between beats vary more; under stress, the rhythm turns more metronomic. Overnight HRV is therefore read as a window on how deeply your body has shifted into recovery mode while you slept.
Around that core sit resting heart rate — which tends to move in the opposite direction, drifting upward when the body is under load — plus sleep duration and estimated sleep quality, and on some platforms respiratory rate and skin temperature. The algorithm compares each input against your personal baseline, weights the deviations according to an unpublished formula, and folds the result into a single number or a traffic-light colour. Everything the score knows about you, it knows from those few overnight streams — nothing more.
The Physiology Underneath Is Real
Let’s be fair to the scores first: the signals they lean on carry genuine information. In elite endurance sport, tracking heart rate variability across weeks of training has been shown to reflect how an athlete is adapting — trends moving one way as positive adaptation takes hold, and becoming disrupted when the training load stops being absorbed. Notably, the researchers behind that work argue for exactly the practice this article will keep returning to: read averaged trends against an individual baseline, not single-day values.
Plews, D.J. et al. (2013). “Training Adaptation and Heart Rate Variability in Elite Endurance Athletes: Opening the Door to Effective Monitoring.” Sports Medicine, 43(9), 773–781.
A systematic review and meta-analysis reached a compatible conclusion across a much wider body of studies: autonomic heart-rate regulation — the territory that HRV and resting heart rate measure — shifts measurably with training status. Improvements in performance tend to travel with increases in parasympathetic markers, and states of heavy overload alter those markers too. In other words, the connection between the sensor data and your recovery status is not a marketing invention; it is established exercise physiology.
Bellenger, C.R. et al. (2016). “Monitoring Athletic Training Status Through Autonomic Heart Rate Regulation: A Systematic Review and Meta-Analysis.” Sports Medicine, 46(10), 1461–1486.
But the Score Is a Recipe, Not a Measurement
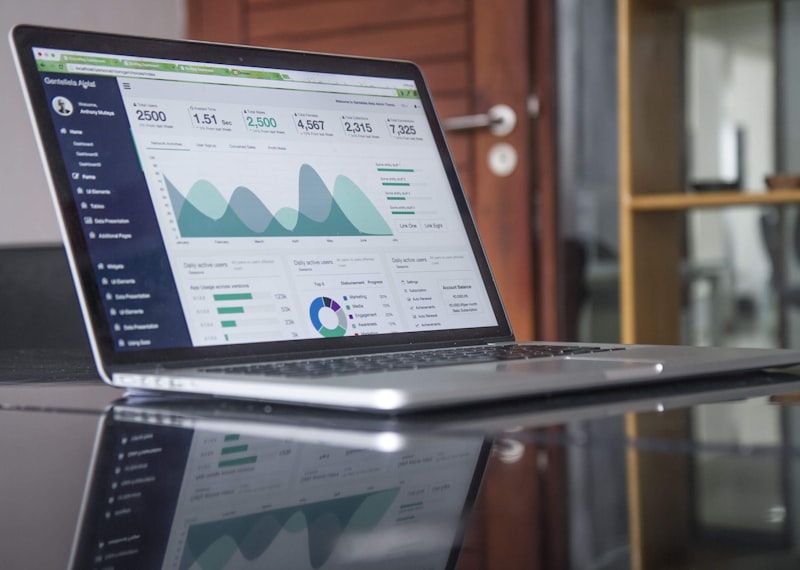
Here is the part the onboarding screens skip. HRV is a measurement. Resting heart rate is a measurement. A recovery score is neither: it is a proprietary blend of measurements, weighted by a formula the company does not publish and can change whenever it likes. Two devices can watch the same person sleep through the same night and wake them with different verdicts, because they sample different signals at different moments and combine them by different recipes. A 70 on one platform is not a 70 on another, and neither number maps onto any physiological unit you could independently verify.
The blend is also blind to context by construction. The model does not know that today holds the presentation you have been dreading, that your knee has been aching since Tuesday, or that the hard session it is nudging you away from is a deliberate part of a training block you planned weeks ago. It reads deviations from baseline, and nothing else. That does not make it useless — it makes it a summary of one narrow channel of evidence, delivered with rather more confidence than one narrow channel deserves.
How You Feel Is Data — Often Better Data
The most striking finding in this literature cuts against the gadget-first instinct entirely. A systematic review of athlete-monitoring research compared subjective measures — simple self-reports of mood, perceived fatigue, muscle soreness and general wellness — with the objective markers commonly used to track the training response, heart rate variability among them. The subjective measures reflected changes in training load as well as or better than the objective ones, and they responded more consistently when the load went up or came down.
Saw, A.E., Main, L.C. & Gastin, P.B. (2016). “Monitoring the athlete training response: subjective self-reported measures trump commonly used objective measures: a systematic review.” British Journal of Sports Medicine, 50(5), 281–291.
Sit with that for a moment: a thirty-second honest check-in — how is my energy, my mood, my soreness, my motivation? — held its own against the instrumented measurements, and often beat them. This does not mean you should discard the sensor data. It means the questionnaire almost nobody fills in is at least as valuable as the sensor almost everybody buys, and that a recovery routine built only on hardware is ignoring its single most sensitive input: you.
What Moves the Number Without Any Training

A large analysis of longitudinal HRV and resting-heart-rate measurements collected in ordinary free-living conditions makes the interpretation problem concrete: day-to-day changes in these markers reflect far more than yesterday’s workout. Alcohol reliably depresses overnight HRV and raises resting heart rate. Oncoming illness pushes the markers in the same direction, often before you notice symptoms. Add a late, heavy meal, a hot bedroom or a stressful week, and the same “poor recovery” flag can be produced by half a dozen different causes — only some of which have anything to do with training.
Altini, M. & Plews, D. (2021). “What Is behind Changes in Resting Heart Rate and Heart Rate Variability? A Large-Scale Analysis of Longitudinal Measurements Acquired in Free-Living.” Sensors, 21(23), 7932.
This reframes what a low score is for. It is not a verdict; it is a prompt to ask why. If you can point at the cause — two glasses of wine, dinner at 23:00, a heatwave — you have learned something actionable about your habits, and the sensible response might be an earlier meal tonight rather than a cancelled workout today. If you cannot explain the dip and it persists for several days, especially alongside feeling genuinely run down, that is worth respecting. The signal lives in the pattern plus the context, never in one amber morning.
Using Recovery Scores Well
None of this argues for throwing the number away. Used with the right posture, a recovery score is a genuinely helpful nudge — a reason to glance at your recent behaviour and listen to your body before deciding how hard to push. A few rules keep it in that role:
- Read the seven-day trend against your own baseline. Single mornings are noisy, and other people’s numbers — or the same number on a different platform — mean nothing. The question is whether your trend is drifting, not what today says.
- Let a low score change intensity, not existence. Swap the interval session for an easy walk, a light spin or mobility work rather than skipping movement altogether — unless you are actually ill, in which case rest properly.
- Check in with yourself before you look. Rate your energy, mood and soreness first, then see the score. This keeps your own perception calibrated — the measure the research says is at least as sensitive — instead of letting a number tell you how you feel.
- Ask why before you obey. Scan the previous day: alcohol, a late meal, heat, stress, short sleep, a hard session, early symptoms. An explained dip is information about a habit; an unexplained, persistent dip is the one worth acting on.
- Notice when the score becomes the stressor. If a bad number ruins your morning, or you catch yourself trying to sleep “for the score,” hide it for a couple of weeks and check weekly summaries instead. A recovery tool that raises your stress is doing the opposite of its job.
Where Lamplit Fits In
The research points at a combination: objective trends plus honest subjective check-ins, side by side. That is precisely the pairing Lamplit is built around. The free app gives you the subjective half in full — a daily journal, mood tracking, and manual logging of workouts, sleep and nutrition — so a thirty-second morning note about your energy and mood lands in the same timeline as what you actually did that day.
Lamplit does have a daily recovery number, Readiness — and it answers this article’s central complaint by publishing its recipe. Readiness weighs your heart rate variability against your own 30-day baseline (35%), last night’s sleep (35%), your recent training load against your own 28-day norm (20%) and your resting heart rate against its own baseline (10%). Each part is shown with its share, a missing input is dropped rather than guessed, and with neither HRV nor sleep there is no score at all. The method and the evidence behind it are public at lamplit.ai/methodology. Readiness is free and runs on your manual sleep and training logs; with Lamplit Pro, the HRV and resting heart rate your watch already measures sync in via Apple Health on iOS or Health Connect on Android and fill in the rest.
Your own check-in keeps the casting vote. When a dip appears, your journal usually explains it — the late dinner, the stressful deadline, the first scratchy-throat note. And on the Max plan, Genie — Lamplit’s AI coach — reads those domains together and surfaces cross-domain patterns you would miss on your own, in plain language. A recipe you can read, and your own context beside it: your numbers, and what they say about each other.
Honest Limits
Two caveats belong in any honest article about recovery tech. First, most of the monitoring research was done on athletes with structured training loads; the signals translate to everyday exercisers, but the evidence there is thinner and individual variation is large. Second, none of this is diagnosis. Consumer devices estimate; they do not examine. A resting heart rate that stays unusually high for weeks, palpitations, chest discomfort or feeling persistently unwell are conversations for a clinician, not a dashboard — whatever the score says, and even if it says nothing at all.
The Bottom Line
Recovery scores are built on real physiology — HRV and resting heart rate genuinely track how your body is absorbing stress — but the score itself is an unverifiable blend that cannot see your context, and the research quietly shows that honest self-report matches or beats the sensors. So treat the number as one voice at the table: watch your own seven-day trend, ask why before you obey, let a bad morning soften your session rather than delete it, and keep your own felt sense in charge. The score works best when it prompts a question — and you answer it.
Frequently asked questions
What does a recovery or readiness score actually measure?
It doesn't measure anything directly. It is a proprietary blend of overnight signals — heart rate variability, resting heart rate, sleep duration and estimated quality, sometimes respiratory rate and skin temperature — compared against your personal baseline and weighted by an unpublished formula. The underlying signals are real physiology; the composite number is a product decision.
Should I skip my workout when my recovery score is low?
Usually adjust rather than skip. A sensible response to a low score is to downgrade intensity — swap intervals for an easy walk, a light spin or mobility work — unless you are actually ill, in which case rest properly. First ask why the score is low: alcohol, a late meal, heat, stress or short sleep explain many dips that have nothing to do with training.
Why do two devices give different recovery scores for the same night?
Each platform samples different signals at different moments and combines them with its own unpublished recipe, so absolute numbers are not comparable across devices. A 70 on one platform is not a 70 on another. Compare your score only against your own baseline on one device, and read seven-day trends rather than single mornings.
Are subjective feelings really as reliable as HRV data?
In a systematic review of athlete monitoring, simple self-reported measures such as mood, perceived fatigue and soreness reflected changes in training load as well as or better than commonly used objective measures, heart rate variability included. That doesn't make sensors useless — the strongest approach combines an honest daily check-in with your objective trends.
Related Articles

Heart Rate Variability: What HRV Really Measures — and How to Improve It
HRV has become the most talked-about metric in recovery and longevity — and one of the most misunderstood. Here's what it actually measures, why it's linked to healthspan, what a 'good' number really means, and the evidence-based ways to raise it.

Overtraining or Under-Recovering? The Warning Signs in Your Data
Most “overtraining” in regular exercisers is really under-recovery. Learn to read the warning signs in your training, heart rate, sleep and mood data — and how to fix them before a dip becomes months on the sidelines.

Alcohol and Recovery: What a Drink Really Does to Your Sleep and HRV
Alcohol makes you fall asleep faster — and then quietly taxes the rest of the night: suppressed REM, a fragmented second half, elevated heart rate and suppressed HRV. Here is what the research and your own wearable data show, and how to run a two-week dry experiment on yourself.
Lamplit Team
We're a team of wellness enthusiasts, developers, and researchers building tools to help people live healthier, more intentional lives. Every article we write is grounded in peer-reviewed scientific research.